Commercial Real Estate in Dallas–Fort Worth: An In-Depth Look at the 2026 Market
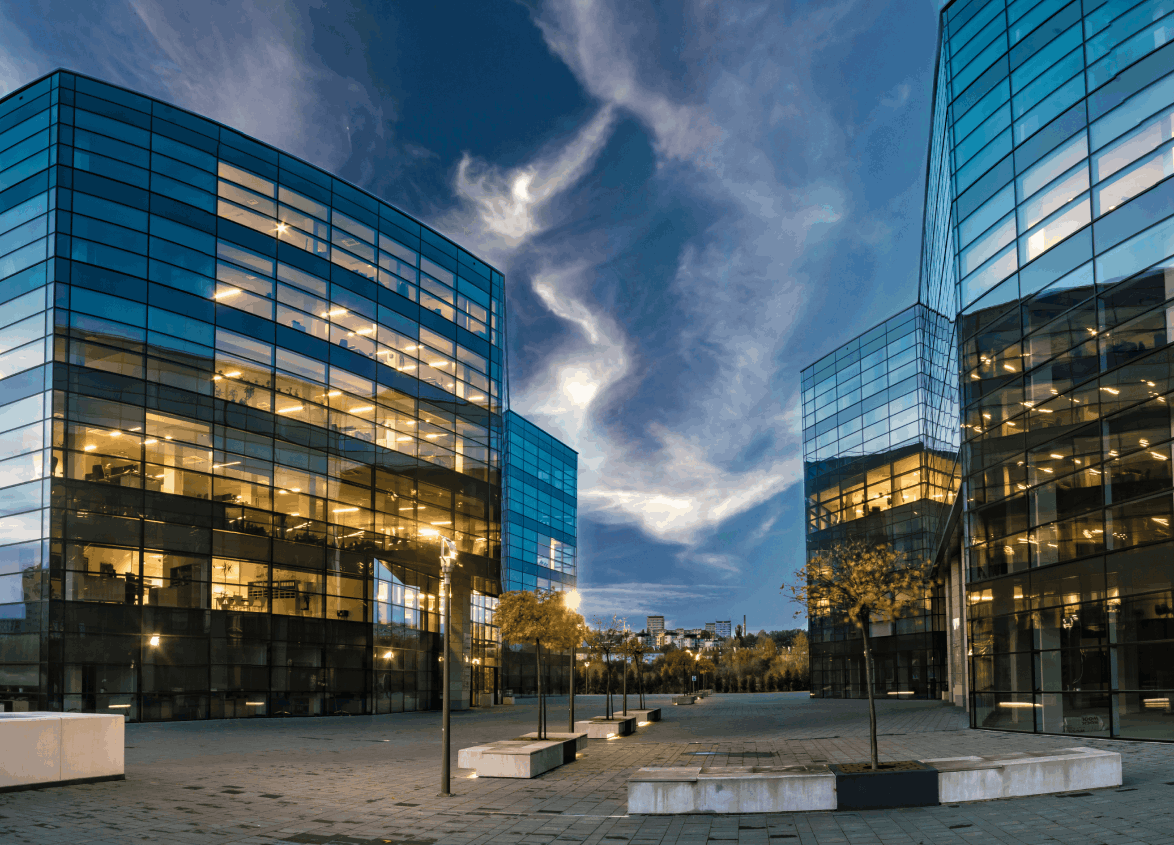
The Dallas–Fort Worth Metroplex isn't just a strong commercial real estate market — by most national rankings, it's the market. The Urban Land Institute and PwC's Emerging Trends in Real Estate report has again placed DFW at the top of the markets to watch, and the fundamentals explain why: a population that has grown to roughly 8.5 million residents, two dozen Fortune 500 headquarters, one of the world's busiest airports, and a diversified economy spanning finance, logistics, healthcare, technology, aviation, and manufacturing.
But "strong" doesn't mean "uniform." Heading into the second half of 2026, DFW's commercial market is increasingly selective — performance now varies sharply by property type, building age, and submarket. Here's what the data actually shows, sector by sector, and what it means whether you own, occupy, or invest in commercial property in North Texas.
The Big Picture: Growth With Discipline
The story of DFW commercial real estate in 2026 is a market that has worked through its post-2021 excesses and come out balanced. Elevated interest rates reset the math on nearly every deal — underwriting is more disciplined, transaction volumes compressed before recovering, and buyers are pricing risk realistically rather than chasing momentum.
What hasn't changed is the demand engine. Corporate relocations keep landing in North Texas. In-migration keeps filling rooftops, which drags retail, industrial, and services along with it. And the region's central geography, labor pool, and pro-business climate keep DFW on virtually every institutional investor's shopping list.
Industrial: The Market Has Turned the Corner
DFW is one of the largest industrial markets in the United States, with total inventory that CoStar-based trackers now put at roughly 1.1 billion square feet. After a 2023–2024 stretch when speculative construction pushed vacancy above 10%, the first quarter of 2026 marked a clear inflection point:
- Vacancy is compressing. Depending on the data provider, overall industrial vacancy sits between roughly 8.7% (Matthews/CoStar) and 9.2% (Lee & Associates) — below 10% for the first time since late 2023, and down meaningfully from the peak.
- Absorption is outpacing supply. Net absorption reached roughly 9.4–9.7 million square feet in Q1 2026 against about 6 million square feet of new deliveries — nearly a 2:1 ratio, the reverse of the oversupply years.
- Leasing hit record first-quarter volume. Roughly 21 million square feet of leases were executed in Q1, led by third-party logistics firms, with headline deals including multiple Google commitments over 1 million square feet each.
- Rents are still growing, just slower. Average asking rents of roughly $9.50–$10.25 per square foot are up about 3.8% year over year — moderating, but still positive pricing power.
- The pipeline is disciplined. Around 28–33 million square feet is under construction, and a large share of it (over 40% by some counts) is already pre-leased.
The nuance underneath: the recovery is concentrated in modern, large-format product. Newmark's data shows buildings delivered since 2006 carry the highest vacancy (~12%) purely because of the recent delivery wave — yet they've captured essentially all of the market's positive absorption over the past three years, while pre-2006 buildings have posted sustained negative absorption. Demand has also broadened beyond e-commerce (now roughly 20% of leasing, down from ~35% at the 2020–2022 peak) toward traditional distribution, manufacturing support, and cold storage.
Submarket picture: South Dallas along I-20/I-45 continues to absorb the biggest logistics requirements thanks to the intermodal facilities, though heavy speculative delivery has lifted vacancy there to roughly 9.5%. The DFW Airport and Las Colinas corridors are the standouts, holding vacancy below 5% on diverse demand from aerospace, defense, and tech distribution, while Fort Worth's western corridor around Walsh Ranch/I-30 is emerging as the next growth node.
Office: A Tale of Two Markets
DFW office is the sector with the widest spread between headline numbers and on-the-ground reality — and, notably, the widest spread between the trackers themselves. Depending on the data set and definitions, overall vacancy is reported anywhere from roughly 20.5% (TenantBase/CoStar) to 25.4% (Partners Real Estate), with CBRE showing availability near 28.5%. Whichever number you use, vacancy is elevated. But the composition matters far more than the average:
- Class A is winning. Class A properties posted positive absorption in Q1 2026 while Class B went sharply negative, and Class A gross rents hit a record of roughly $37.47 per square foot even as older product struggles to backfill.
- Leasing activity is genuinely recovering. Tenant demand has picked up meaningfully, concentrated in amenity-rich, move-in-ready space in submarkets like Legacy/Frisco and Richardson/Plano — recent commitments include KFC's 147,000-square-foot Plano headquarters space and Cigna's 105,000 square feet, also in Plano.
- DFW is still building when almost nobody else is. Yardi Matrix data ranks DFW's active office pipeline (roughly 2.6–3.1 million square feet) third in the nation behind only Boston and Manhattan — a bet on the region's long-term office demand that few markets can make.
- Capital is returning. Trailing twelve-month office sales volume is approaching $1.8 billion at an average of roughly $320 per square foot and cap rates around 8.4%, with year-to-date investment outpacing most peer metros.
The practical read: "the DFW office market" barely exists as a single thing anymore. A 1980s Class B tower and a new Legacy West building are in different businesses. Owners of commodity product face repositioning decisions; tenants willing to consider quality Class B space have more leverage than at any point in a decade, while the best Class A space is genuinely competitive.
Retail: The Tightest Sector in the Metroplex
Retail is DFW's quiet overperformer. Overall vacancy sits at roughly 5.1–5.4% — up slightly on bankruptcy-related move-outs and new deliveries, but still far below the 9–10% levels of the early 2010s, and most second-generation space is being reabsorbed quickly.
- Rents are climbing fast. Average asking rates rose about 7.3% year over year to roughly $21.23 per square foot, with North Central Dallas, Central Dallas, and East Dallas commanding premiums.
- New supply is essentially spoken for. Around 6.8–7 million square feet is under construction, and 75–80% of it is pre-leased — concentrated in the northern and southwestern growth corridors, following the rooftops.
- The submarket spread is wide. East Dallas Outlying runs vacancy as low as ~2.3%, while Southwest Dallas sits around 8.2% — a reminder that retail performance in DFW is a street-corner business, not a metro-wide one.
- Investors are back. Q1 2026 retail sales volume reached roughly $560 million, a sharp acceleration from late 2025, with grocery-anchored centers and single-tenant net lease assets trading in the high-5% to mid-7% cap rate range.
For tenants, tight vacancy means the leverage picture is the opposite of office: quality retail space in growth corridors is scarce, landlords know it, and starting the search early matters. For owners of well-located centers, this is a seller-friendly environment.
Multifamily and the Demand Drivers Behind Everything Else
Multifamily remains resilient, with cap rates holding around the mid-5% range and new supply being absorbed efficiently as the rent-versus-buy math continues to favor renting for many households. But multifamily's bigger role in a commercial conversation is as a leading indicator: every new rooftop in Celina, Anna, Midlothian, or Fort Worth's west side pulls retail pads, medical office, self-storage, and shallow-bay industrial behind it.
Layer on the data center boom — DFW has become one of the country's most active data center markets, with power availability now a genuine site-selection constraint — and the demand picture for land and industrial-adjacent product gets even stronger.
What This Means for You
If you own commercial property: The market is rewarding quality and punishing the average. Well-leased industrial, grocery-anchored retail, and stabilized assets with durable income are attracting deep buyer pools; aging office and commodity product face a harder conversation. Either way, pricing strategy matters more in a selective market than it ever did in a rising one — this is not an environment to guess at value.
If you lease space: The leverage map is sector-specific. Industrial tenants still have options, but the window of peak leverage is narrowing as vacancy compresses and pre-leasing absorbs the pipeline. Office tenants — especially those open to strong Class B or near-Class-A space — may be negotiating in the most favorable conditions they'll see for years. Retail tenants in growth corridors should expect competition and plan 12–18 months ahead.
If you invest: The reset in rates has produced something rare: a DFW market where the fundamentals are excellent and the pricing is rational. Industrial is trading around a 6.2% average cap rate at roughly $147 per square foot, office at an 8.4% average cap for those willing to underwrite the risk, and retail in the high-5s to mid-7s. Disciplined underwriting wins; momentum buying doesn't.
Talk to Someone Who Works This Market Every Day
Market reports tell you where DFW has been. Getting the next deal right — the listing price, the lease terms, the submarket call — takes someone working these corridors daily. OnDemand Realty Commercial is headquartered in Frisco and serves the entire Metroplex, from Collin County's growth corridors to the industrial belts of South Dallas and Fort Worth.
Categories
Recent Posts